Statistical Communique of
on the 2013 National Economic and Social Development
March 14, 2014
In 2013, faced with the severe economic downward pressure and multiple difficulty of lack of rain and high temperature, Hunan Provincial Committee of CCP and the Government led the people all over the province to implement the decisions of the central government, insist on the general keynote of the policy that advance steadily, strongly promote “The three volume” and “Four modernizations Two types”, build a moderately prosper-ous society overview and co-ordinate the works of stabilizing growth, adjust structure, promote reform and improve people's livelihood. As a result, the province's economic and social development steady to progress , steady to good and steady improve.
I. General Outlook
Preliminary estimation indicated that the Gross Domestic Product (GDP) of the province in 2013 amounted to 2450.17 billion yuan, up by 10.1% over the previous year. Of this total, the value-added of the primary industry was 309.92 billion yuan, up by 2.8 %. The value-added of the secondary industry was 1151.74 billion yuan, up by 10.9%. The value-added of the tertiary industry was 988.51 billion yuan, up by 11.4%. Calculated by permanent residents, Per Capital GDP was 36,763 yuan, up by 9.3%.

The structure of the GDP was 12.7∶47.0∶40.3. The value-added of industrial sector accounted for 40.8% of the GDP, down by 0.4% over the previous year. The value-added of new- and high-technology industries accounted for the GDP was 16.3%, rose by 1.3 % points over the previous year. The contribution to the GDP about the primary industry、secondary industry and tertiary industry was 3.5%、51.9% and 44.6% respectively. Of which, the value-added of industrial sector reached 46.4%, the value-added of the production service industry reached 20.8%. The value-added of non-state-owned economy was 1418.61 billion yuan, up by 11.5%; which accounted for 57.9% of GDP.
Looking from regions, the GDP of Changsha, Zhuzhou and Xiangtan cities was 1053.92 billion yuan, up by 11.5%; The GDP of the rim Chang-Zhu-Tan city clusters was 1964.54 billion yuan, up by 11%; The GDP of the South Region of Hunan Province was 501.67 billion yuan, up by 10.3%; The GDP of the Western Region of Hunan Province was 314.12 billion yuan, up by 8.8%. The GDP of the Dongting lake ecological economic zone was 624.61 billion , up by 10.5%.
Ⅱ. Agriculture
In the primary industry, the value-added of agriculture was 190.96 billion yuan, up by 2.8% over the previous year; the value-added of forestry was 21.28 billion yuan, up by 6.0%; the value-added of animal husbandry was 66.62 billion yuan, up by 0.6%; the value-added of fishery was 20.17 billion yuan, up by 6.3%.
The sown area of grain was 4937.0 thousand hectares, up by 0.6%.The sown area of cotton was 160.0 thousand hectares, down by 7.3%. The sown area of sugar crops was 14.0 thousand hectares, down by 1.6%. The sown area of oil-bearing crops was 1383.0 thousand hectares, up by 4.6%. The sown area of vegetables was 1284.0 thousand hectares, up by 3.6%.
The total output of grain decreased by 2.7% over the previous year. The output of oil-bearing crops increased by 8.0%,the output of cotton decreased by 21.0%,the output of tea increased by 7.9%, the output of vegetable increased by 3.5%, the output of tobacco increased by 7.0%. The total meat output of pork, beef and mutton increased by 1.1%,the output of egg increased by 0.4%,the output of milk increased by 4.7%,the output of aquatic increased by 6.3%17.0 thousand hectares of farmland was increased all year round with effective irrigation systems and another 14.0 thousand hectares was increased with water-saving irrigation systems.61 thousand water projects have been newly built, which invested 24.0 billion yuan, finished 800 million cubic meters of earth and stone. 1200 main projects of dam reinforcement were completed. 8,056 kilometers of rural roads were built.
III. Industry and Construction
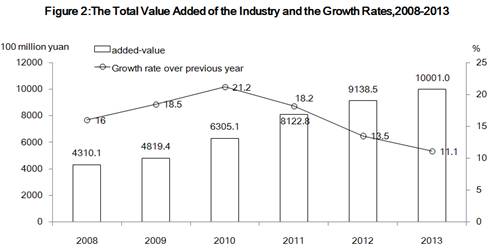
The total value added of the industrial sector was 1000.10 billion yuan, up by 11.1% over the previous year. Of which, the value added of industrial enterprises above the designated size increased by 11.6%. The new product value of industrial enterprises above the designated size increased 23.2% which accounted for 13.1% in the whole industry and increased by 1.0% over last year. In industrial enterprises above the designated size, the value added of high degree processing industry and high-tech industry was 14.1% and 27.3%.The value added of them accounts for 35.6% and 9.0% in whole industrial enterprises above the designated size and increased by 1.0% and 1.5% over the previous year. The growth of the value added for the major six high energy consuming industries was 12.8%,account for 31.6% in whole industrial enterprises above the designated size.The value-added of the industrial enterprises above designated size of non-state-owned economy increased by 14.7%. In terms of different regions, the value-added of industrial enterprises above the designated size for Changsha, Zhuzhou and Xiangtan cities increased by 13.2%; The value-added of the rim Chang-Zhu-Tan city clusters increased by 13.2%; The value-added of the South Region of Hunan Province increased by 12.0%; The value added of the Western Region of Hunan Province increased by 9.4%.The value added of the Dongting lake ecological economic zone increased by 12.1%.
In the statistics of industrial products about the industrial enterprises above designated size, the production of the 272 industrial products increased, which accounted for 66.3% of the whole industrial products. The output of electricity was 127.72 billion kilowatt-hours, up by 6.5%;the output of plate glass was 18328.0 thousand weight cases, up by 1.6%; the output of crude oil processed was 9451.0 thousand tons, up by 3.5%;the output of cement was 112647.0 thousand tons, up by 9.2%; the output of steel was 19779.0 thousand tons, up by 6.5%; the output of ten kinds of Nonferrous Metals was 3014.0 thousand tons, up by 9.8%; the output of motor vehicles was 460.0 thousand, up by 78.6%.
Table 1: Output of Major Industrial Products, 2013
|
Product |
Unit |
Output |
Increase
over |
|
Salt |
10,000
tons |
256.9 |
1.3 |
|
Rice |
10,000
tons |
1198.5 |
1.4 |
|
Feedstuff |
10,000
tons |
1534.9 |
9.6 |
|
Edible Vegetable Oil |
10,000
tons |
279.7 |
1.5 |
|
Cigarettes |
100
million |
1862.1 |
1.3 |
|
Machine-made Paper and Paper boards |
10,000
tons |
421.4 |
-8.0 |
|
Crude Oil Processed |
10,000
tons |
945.1 |
3.5 |
|
Sulfuric Acid |
10,000
tons |
309.7 |
9.2 |
|
Caustic Soda |
10,000
tons |
75.0 |
3.8 |
|
Synthetic Ammonia |
10,000
tons |
152.3 |
-4.4 |
|
Chemical Fertilizers |
10,000
tons |
134.6 |
-21.5 |
|
Cement |
10,000
tons |
11264.7 |
9.2 |
|
Plate Glass |
10,000
weight cases |
1832.8 |
1.6 |
|
Pig iron |
10,000
tons |
1739.8 |
2.0 |
|
Crude Steel |
10,000
tons |
1840.4 |
4.8 |
|
Rolled Steel |
10,000
tons |
1977.9 |
6.5 |
|
Ten kinds of Nonferrous Metals |
10,000
tons |
301.4 |
9.8 |
|
Silver |
ton |
7190.2 |
24.9 |
|
Jack-up Equipment |
10,000
tons |
138.0 |
-5.9 |
|
Concrete Machinery |
10,000
units |
7.1 |
-8.3 |
|
Motor Vehicles |
10,000
units |
46.0 |
78.6 |
|
Of which:Car |
10,000
units |
31.8 |
95.2 |
|
Power Generating Equipment |
10,000
kilowatts |
135.9 |
41.9 |
|
AC Electric Motor |
10,000
kilowatts |
1797.2 |
9.8 |
|
Electronic Component |
10,000
units |
656.3 |
25.2 |
|
Transformer |
10,000
KVA |
10074.1 |
-2.3 |
|
Electricity |
100
million kilowatt-hours |
1277.2 |
6.5 |
The revenue of main business of industrial enterprises above designated size increased by 13.7% over last year. The profits after balancing out between deficits and surpluses was 158.51 billion yuan, up by 19.2%. Of this total, the profits of the state-owned was 18.99 billion yuan, up by 33.6%; that of the collective enterprises was 2.07 billion yuan, up by 19.3%; that of the share collaboration enterprises was 0.94 billion yuan, up by 9.6%;that of the share-holding enterprises was 99.17 billion yuan, up by 18.0%;that of the enterprises by foreign investors and investors from Hong Kong, Macao and Taiwan was 12.88 billion yuan, up by 17.1%; that of others was 24.46 billion yuan, up by 16.1%.All the industrial enterprises above designated size achieved overall profits. The total profits in the top five were manufacture of special purpose machinery, manufacture of non-metallic mineral products, manufacture of raw chemical materials and chemical products, manufacture of cigarette, agricultural food processing industry,and their profits respectively were 16.43 billion yuan, 13.47 billion yuan, 12.56 billion yuan, 11.86 billion yuan and 9.75 billion yuan.
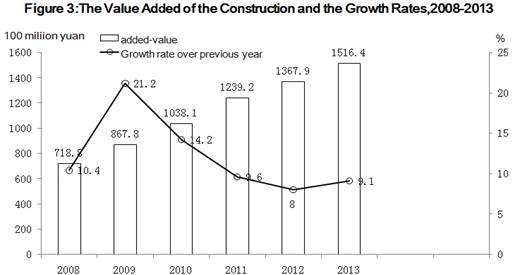
The value-added of construction enterprises was 151.64 billion yuan, up by 9.1%. The profits made by construction enterprises with qualification certificates through general contracts and specialized contracts reached 18.44 billion yuan, up by 23.3%. The floor space of building under construction was 4314.19 million square meters, up by 18.5%. The floor space of building completed 1552.85 million square meters, up by 15.9%.
IV. Investment in Fixed Assets
The completed investment in fixed assets (excluding rural households) was 1838.14 billion yuan, up by 26.1% over the previous year. Looking from urban-rural, the investment in urban area was 1621.11 billion yuan, up by 22.8%; the investment in rural area was 217.03 billion yuan, up by 57.9%. Looking from economic type,the investment in state-owned economy was 557.44 billion yuan, up by 21.7%; the investment in non-state-owned economy was 1280.70 billion yuan, up by 28.1%,private investments are 1147.75 billion yuan, up by 29.9%.According to the investment direction,the investment in people's livelihood was 108.80 billion yuan, which increased by 1.1 times;ecological investment was 61.81 billion yuan, up by 44.9%;Infrastructure investment was 414.72 billion yuan, up by 25.6%;the investment in high-tech industries was 70.51 billion yuan, up by 17.8%;the investment in technological upgrading was 696.99 billion yuan, up by 23.8%;the investment in strategic emerging industries was 420.60 billion yuan, up by 35.5%. In terms of different regions, the fixed-asset investment in Changsha, Zhuzhou and Xiangtan cities was 731.36 billion yuan, up by 21.9% ; The investment in the rim Chang-Zhu-Tan city clusters was 1315.04 billion yuan, up by 26.6%; the investment in the South Region of Hunan Province was 398.57billion yuan, up by 34.4%;the investment in the Western Region of Hunan Province was 240.60 billion yuan, up by 33.0%;the investment in the Dongting lake ecological economic zone was 371.18 billion yuan, up by 32.5%.
Table 2: Fixed Assets Investment and Its Growth by Sector, 2013
|
Sector |
Investment (100
million yuan) |
Increase
over 2012(%) |
|
Fixed Assets Investment (Excluding Rural
Households) |
18381.4 |
26.1 |
|
Primary Industry |
633.9 |
35.4 |
|
Secondary Industry |
8080.8 |
27.6 |
|
Of which: Mining |
647.6 |
16.3 |
|
Manufacturing |
6668 |
30.2 |
|
Production and Distribution of Electricity, Gas and Water |
610.9 |
20.2 |
|
Construction |
154.2 |
5.5 |
|
Tertiary Industry |
9666.8 |
24.3 |
|
Of which:Wholesale
and Retail |
592.1 |
38.2 |
|
Traffic, Transport, Storage and Post |
1381.9 |
10.4 |
|
Accommodation and Catering |
247.1 |
29.3 |
|
Information Transfer, Computer Services |
93.1 |
51.8 |
|
Finance |
57.8 |
24.0 |
|
Real Estate Trade |
3323.1 |
16.3 |
|
Leasing and Business Services |
359.5 |
20.2 |
|
Scientific Research, Technical Service |
139.6 |
15.5 |
|
Management of Water Conservancy
Environment and Public Establishment |
2099.6 |
40.2 |
|
Residents Service,Repair
and other Services |
86.4 |
17.3 |
|
Education |
302.3 |
34.6 |
|
Sanitation, Social Work |
172.4 |
43.6 |
|
Culture, Sports and Entertainment |
200.6 |
68.8 |
|
Public Management, Social Security and
Social Organization |
611.4 |
25.8 |
The province's total number of construction projects was 35864,the number of the projects that were undertaken this year was 24329. The investment in 2730 projects over-100-million-yuan was 490.92 billion yuan, which accounted for 26.7% of the total project investment. By the end of this year, the total length of express-ways open to traffic reached 5084 kilometres, an increase of 1116 kilometres over the previous year.
The investment in real estate development of the province was 262.83 billion yuan, up by 18.9% over the previous year. Of this total, the investment in residential buildings reached 184.58 billion yuan, up by 17.4%;The floor space of commercialized buildings sold was 59.524 million square meters, up by 15.6%. Of which, the floor space of residential buildings sold was 54.115 million square meters, up by 16.0%. The total sale of commercialized buildings was 252.56 billion yuan, up by 21.1%. Of which, the sale of residential buildings was 211.50 billion yuan, up by 23.6%.
V. Domestic Trade and Price
The total retail sales of consumer goods of the province reached 894.06 billion yuan, a growth of 13.8% over the previous year. An analysis on different areas showed that the retail sales of consumer goods in urban areas stood at 803.35 billion yuan, up by 13.9%, and that in rural areas reached 90.71 billion yuan, up by 13.3%. In terms of different regions, the total retail sales of consumer goods in Changsha, Zhuzhou and Xiangtan cities reached 386.03 billion yuan, up by 14.1%; that in the rim Chang-Zhu-Tan city clusters was 684.30 billion yuan, up by 14.0%; that in the South Region of Hunan Province was 173.29 billion yuan, up by 13.5%;that in the Western Region of Hunan Province was 113.78 billion yuan, up by 13.4%;that in the Dongting lake ecological economic zone was 197.59 billion yuan, up by 13.9%.
The retail sales of Corporate wholesale and retail enterprises above designated size was 349.49 billion yuan, up by 16.3% over the previous year,of which the retail sales of grain and oil, food, beverage, tobacco and liquor increased by 21.3%,the retail sales of shoes, hats, knit and textile goods increased by 14.8%,the retail sales of gold and silver jewelry increased by 40.0%,the retail sales of daily supplies increased by 19.7%,the retail sales of household appliances and audiovisual equipment increased by 23.8%,the retail sales of oil and related products increased by 9.8%,the retail sales of cars increased by 18.3%.
Table 3: Retail Sales of Consumer Goods and Its Growth, 2013
|
Item |
Value |
Increase
over 2012(%) |
|
Total Retail Sales of Consumer Goods |
8940.6 |
13.8 |
|
By Location of Outlets |
|
|
|
Urban |
8033.5 |
13.9 |
|
Rural |
907.1 |
13.3 |
|
By Size |
|
|
|
above Designated Size |
4501.2 |
18.4 |
|
under Designated Size |
4439.4 |
9.6 |
|
Wholesale and Retail Sales of Commodities
by Enterprises above Designated Size |
3494.9 |
16.3 |
|
Of which: Grain and Oil, Food, Beverage, Tobacco
and Liquor |
396.3 |
21.3 |
|
Garments, Shoes, Hats, knit and Textile
Goods |
273.0 |
14.8 |
|
Cosmetics |
43.1 |
23.1 |
|
Gold, Silver and Jewelry |
63.5 |
40.0 |
|
Articles for Daily Use |
99.1 |
19.7 |
|
Hardware & Electric Materials |
28.4 |
28.3 |
|
Sports and Recreations |
7.6 |
10.8 |
|
Newspapers & Magazines |
63.4 |
17.1 |
|
Electronic Publication and Audiovisual Products |
3.6 |
25.1 |
|
Household Appliances and Audiovisual Equipment |
237.7 |
23.8 |
|
Traditional Chinese and Western Medicines |
222.7 |
11.8 |
|
Culture and Official Goods |
51.0 |
24.0 |
|
Furniture |
22.9 |
30.9 |
|
Communication Appliances |
35.2 |
5.5 |
|
Coal and Related Products |
51.2 |
13.3 |
|
Oil and Related Products |
782.0 |
9.8 |
|
Building and Decoration Materials |
51.9 |
5.5 |
|
Mechanical & Electrical Products and
Appliances |
21.3 |
11.7 |
|
Motor Vehicles |
953.4 |
18.3 |
The general level of consumer prices in
Table 4:Consumer Price Indices, 2013
|
Item |
Increase
over 2012(%) |
|
Consumer Price Index |
2.5 |
|
Of which: Food |
4.2 |
|
Tobacco, Liquor and Articles |
3.1 |
|
Clothing |
2.3 |
|
Household Facilities, Articles and
Services |
1.8 |
|
Health Care and Personal Articles |
1.7 |
|
Transportation and Communication |
0.0 |
|
Recreation, Education and Culture Articles |
2.1 |
|
Residence |
1.8 |
VI. Foreign Economic Relations
The total value of import and export was 25.16 billion US dollars, up by 14.7% over the previous year. Of which, the export value was 14.82 billion US dollars, up by 17.6%,the import value was 10.34 billion US dollars, up by 10.7%. By customs regime, the export value of general trade was 10.11 billion US dollars, up by 16.8%; the export value of processing trade was 4.50 billion US dollars, up by 17.4%. Looking from the key commodities,the export value of mechanical and electrical products was 5.77 billion US dollars, up by 13.4%, which accounted for 38.9% of the total volume; the export value of high-and-new-tech products was 1.66 billion US dollars, up by 20.0%, which accounted for 11.2% of the total volume; the export value of farm products was 0.88 billion US dollars, up by 24.2%.
Table 5: Import and Export , 2013
|
Item |
Value(100
million USD) |
Increase
over 2012(%) |
|
Total import and export |
251.6 |
14.7 |
|
Export |
148.2 |
17.6 |
|
By Trade Mode |
|
|
|
Of which: General trade |
101.1 |
16.8 |
|
Processing trade |
45.0 |
17.4 |
|
By Key Commodities |
|
|
|
Of which: Mechanical and electronic
products |
57.7 |
13.4 |
|
High and new-tech products |
16.6 |
20.0 |
|
Farm Products |
8.8 |
24.2 |
|
Import |
103.4 |
10.7 |
|
By Trade Mode |
|
|
|
Of which: General trade |
69.2 |
4.6 |
|
Processing trade |
31.6 |
24.6 |
|
By Key Commodities |
|
|
|
Of which: Mechanical and electronic
products |
30.8 |
-12.5 |
|
High and new-tech products |
11.6 |
-3.4 |
|
Farm Products |
4.7 |
24.5 |
The foreign capital actually utilized was
8.70 billion US dollars, up by 19.6%. Of which, the foreign capital actually
utilized in industry was 5.82 billion US dollars, up by 3.8%. There were 36
projects of foreign investment which above 30 million US dollar newly approved.
Three enterprises of the world top 500 were newly introduced, and the number
reached 131 by the end of 2013. The actually utilized capital out of the
province and inside
The value in the new contracts signed through contracted projects, labour contracts and design and consultancy services reached 4.52 billion US dollars, up by 41.0%. The accomplished business revenue was 3.30 billion US dollars, up by 28.3%. The labour service population dispatched out of the country reached 60 thousand, up by 28.3%. 168 enterprises investing abroad were newly approved. The overseas investment was 1.58 billion dollar.
VII. Transportation, Post, Telecommunications and Tourism
The total passenger and freight transport turnover were 524.86 billion ton-kilometres, up by 7.0% over the previous year. The total freight flows were 428.19 billion ton-kilometres, up by 6.9%.Of this total, the freight flows by railways were 96.95 billion ton-kilometres, down by 7.1%; and the freight flows by highways were 271.31 billion ton-kilometres, up by 13.4%. The total passenger flows were 189.15 billion person-kilometres, up by 8.2%. Of this total, the passenger flows by railways were 86.57 billion person-kilometres, down by 7.6%; the passenger flows by highways were 92.51 billion person-kilometres, up by 8.3%; the passenger flows by air were 9.80 billion person-kilometres, up by 12.5%.
Table 6: Main Indicators of Transportation, 2013
|
Item |
Unit |
Volume |
Increase
over 2012(%) |
|
Freight traffic |
10000
tons |
211405.9 |
10.5 |
|
Railways |
10000
tons |
4901.4 |
-8.2 |
|
Highways |
10000
tons |
185073.2 |
11.0 |
|
Waterways |
10000
tons |
20690.2 |
10.6 |
|
Civil aviation |
10000
tons |
6.1 |
4.7 |
|
pipeline |
10000
tons |
735.0 |
11.8 |
|
Passenger traffic |
10000
persons |
197591.4 |
6.7 |
|
Railways |
10000
persons |
9116.8 |
7.0 |
|
Highways |
10000
persons |
186333.6 |
6.7 |
|
Waterways |
10000
persons |
1384.2 |
2.6 |
|
Civil aviation |
10000
persons |
756.8 |
6.8 |
At the end of the year, the province's highway mileage reached 235 thousand kilometres, up by 0.6%. The total number of motor vehicles for civilian use reached 3978.0 thousand by the end of 2013, up by 16.9%. Of which, the number of private-owned vehicles was 3272.0 thousand, up by 20.6%. The number of cars for civilian use was 1949.0 thousand, up by 23.1%.
The total turnover of postal and telecommunication services were 53.90 billion yuan, up by 10%. Of this total, postal services accounted for 6.03 billion yuan, up by 23.8%; and telecommunication services accounted for 47.87 billion yuan, up by 8.5%. Capacity of office telephone exchanges reached 8.698 million lines, down by 3.1%. The fixed phone user numbered 9.230 million households. The mobile phone user numbered 45.633 million households, an increase of 2.564 million households. The internet user through broad band reached 7.181 million households, up by 15.9%.
The number of domestic tourists was 360 million, up by 18.3%. The number of international tourists was 2.307million,up by 2.7%. The total revenue from tourism was 268.19 billion yuan, up by 20.0%. Of which, the revenue from domestic tourism reached 263.09 billion yuan, up by 20.9%; the revenue from international tourism reached 0.82 billion US dollars, down by 11.4%.
VIII. Finance and Insurance
The governmental communal revenue was 330.73 billion yuan in the province, up by 12.6%. Local government revenue was 202.36 billion yuan, up by 13.5%. Of which, tax revenue reached 129.78 billion yuan, up by 16.8%; non-tax revenue reached 72.58 billion yuan, up by 8.1%. The two-tax revenue handing into govern-ment was 99.67 billion yuan, up by 10.6%. The income tax revenue handing into central government was 28.02 billion yuan, up by 13.1%.The total government expenditure was 463.55 billion yuan in the province, up by 12.5%. Of which, general public service, social security and employment, Medical and health service, urban and rural area community operating and affairs of agriculture/forestry/water resources separately expended 69.04 billion yuan, 61.57 billion yuan, 33.51 billion yuan, 35.54 billion yuan and 50.03 billion yuan, up by 25.5%, 17.1%, 13.9%, 17.6% and 11.7%.
Table 7: Governmental Communal Revenue and Expenditure and these Growth Rate, 2013
|
Item |
Value |
Increase
Over 2012(%) |
|
Communal Revenue |
3307.3 |
12.6 |
|
Of which: Local Government Revenue |
2023.6 |
13.5 |
|
Of which: Tax Revenue |
1297.8 |
16.8 |
|
Non-tax Revenue |
725.8 |
8.1 |
|
Two-tax Revenue Handing into Central Government |
996.7 |
10.6 |
|
Income Tax Revenue Handing into Central Government |
280.2 |
13.1 |
|
Communal Expenditure |
4635.5 |
12.5 |
|
Of which: general public service |
690.4 |
25.5 |
|
Education |
807.9 |
0.0 |
|
science and technology |
54.0 |
12.0 |
|
Culture, sports and media |
66.5 |
22.0 |
|
Social security and employment |
615.7 |
17.1 |
|
Medical and health service |
335.1 |
13.9 |
|
energy conservation and environment protection |
120.2 |
9.9 |
|
urban and rural area community operating |
355.4 |
17.6 |
|
affairs of agriculture , forestry and
water resources |
500.3 |
11.7 |
|
housing safeguards |
166.1 |
-10.7 |
At the end of 2013, savings deposits in Renminbi and foreign currencies in all items of financial institutions were 2687.60 billion yuan, newly increased 372.56 billion yuan compared to the beginning of the year. Of which, the savings deposits of corporations were1096.04 billion yuan, newly increased 149.89 billion yuan and the savings deposits of urban and rural residents were 1478.45 billion yuan, newly increased 207.63 billion yuan. Loans in Renminbi and foreign currencies in all items of financial institutions reached 1814.11 billion yuan, newly increased 244.87 billion yuan compared to the beginning of the year. The short-term loans reached 556.51 billion yuan, newly increased 749.5 billion yuan and the medium-term and long-term loans reached 1229.49 billion yuan, newly increased 175.56 billion yuan. The loans in real estate development, medium-sized and small enterprises and affordable housing construction respectively reached 91.51 billion yuan, 712.54 billion yuan and 15.06 billion yuan.
Table 8:The balance of Deposits and loans of local foreign currency of financial institution, 2013
|
Item |
Balance
at the Year-end (100
million yuan) |
Increase
Over the |
|
Deposits |
26876.0 |
3725.6 |
|
Of which: Deposits of Enterprises |
10960.4 |
1498.9 |
|
Savings Deposits |
14784.5 |
2076.3 |
|
Of which: Deposits in Renminbi |
26756.6 |
3716.3 |
|
Loans |
18141.1 |
2448.7 |
|
Of which: Short-term Loans |
5565.1 |
749.5 |
|
Medium-term and Long-term |
12294.9 |
1755.6 |
|
Of which: Loans in Renminbi |
17775.0 |
2394.7 |
At the end of 2013, the number of listed
companies reached 87. Of which, the number of listed companies in
The insurance premium of all the insurance companies reached 50.86 billion yuan, up by 9.3% over the previous year. Of which, the life insurance premium amounted to 28.61 billion yuan, up by 0.9%; the healthy insurance premium amounted to 3.27 billion yuan, up by 33.3%; the accidence injury insurance premium amounted to 1.37 billion yuan, up by 13.7%; the property insurance premium amounted to 17.60 billion yuan, up by 21.4%. Insurance companies paid an indemnity worth of 19.28 billion yuan, up by 35.1%.
IX. Education, Science and Technology
By the end of 2013, there were 107 general universities and colleges in the province. The graduates’ number of general universities and colleges was 294 thousand, the post-graduates’ number 17 thousand, the graduates’ number of vocational secondary schools 237 thousand, the graduates’ number of senior secondary schools 317 thousand, the graduates’ number of junior secondary schools 667 thousand, the graduates’ number of primary schools 771 thousand. Kindergartens accommodated 1.912 million children, up by 8.4%. The enrolment rate of school-age children was 99.96%, and the gross rate of senior secondary school education was 88.2%. There were 11,168 all kinds of private schools, which had 2.199 million students in school.
Table 9: Student Enrollment, New student Enrollment and Graduates, 2013
|
Item |
New
Student Enrollment (10,000
persons) |
Increase
over 2012 (%) |
Student
Enrollment(10,000 persons) |
Increase
over 2012 (%) |
Graduates (10,000
persons) |
Increase
over 2012 (%) |
|
Postgraduates |
2.1 |
3.5 |
6.5 |
4.1 |
1.7 |
6.2 |
|
Regular Institution of Higher Education |
32.7 |
0.4 |
110.1 |
1.7 |
29.4 |
-4.0 |
|
Vocational Secondary Schools |
22.9 |
-9.6 |
65.1 |
-11.4 |
23.7 |
-5.7 |
|
Senior Secondary Schools |
37.4 |
1.0 |
104.1 |
1.4 |
31.7 |
2.2 |
|
Junior Secondary Schools |
76.7 |
3.2 |
214.3 |
1.5 |
66.7 |
-3.2 |
|
Primary Schools |
84.8 |
-3.8 |
467.8 |
-1.3 |
77.1 |
0.0 |
|
Special Education |
0.2 |
22.2 |
1.0 |
-1.0 |
0.2 |
54.5 |
By the end of 2013, there were 14
state-level engineering technology research centers and 9 provincial-level
engineering technology research centers. Meanwhile, there were 12 state-level
key laboratories and 104 provincial-level key laboratories. A total number of
662 projects under national science and technology development programs were
implemented. Of this total, 45 projects were under the Hi-tech Research and
Development Program (the 863 Program). 6544 technology contracts have been
signed and their total amounts reach 7.71 billion yuan.
902 items were registered as scientific and technological achievements.15 items
winning national prize for progress in science and technology, 4 items winning national
award for technological invention and 1 item winning state natural science
award. Super hybrid rice created a per-mu yield of
988.1 kilograms, which is the highest record in the world; An exascale computer called “Tianhe
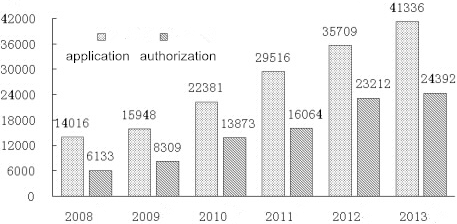
Figure 4: The number of patent application and patent authorization, 2008-2013
There were 1,653 laboratories for product inspection, an increase of 69. Of which, there were 18 national quality testing and inspection centres, an increase of 2. There were 103 authorized measurement institutions, 96 special equipment inspection institutions. Key quality supervision and spot check of industrial products reached 9,593. A total of 20 national standards and 156 local standards were developed in the year. Mapping departments published 125 types of maps. There were 30,056 geodetic survey achievements, 11329 pieces of aerial photogram metric and 31,915 results of basic geographic information data, provided for the economic and social development.
X.Culture, Public Health and Sport
At the end of 2013, there were 93 art-performing groups, 142 culture centres, 134 public libraries, 96 museums and memorials. There were 13 radio broadcasting stations and 15 television stations. The users of CATV were 8401 thousand households,an increased of 942 thousand households. Broadcasting and television coverage rates were 93.32% and 97.40%, separately up by 0.37 and 0.23 % points. There were 99 state-level non-material cultural heritage protection projects and 220 provincial level protection projects in the province. All sorts of books were issued for 9,771 types, newspaper 87 types, and magazines 247 types. A total of 280 million copies of books were published, 1.05 billion copies of newspapers and 130 million copies of magazines were issued.
There were 61,359 health institutions in the province, including 3226 general hospitals and health centers, 139 maternal and child health-care institutions, 87 specialized health institutions, 655 community health service (CHS) centers, 10,218 clinics/health-centers/infirmaries and 44,929 village clinics. There were 321 thousand health technicians, up by 8.1%. Of which, practicing doctors and assistant practicing doctors were 126 thousand, up by 8.1%; registered nurses were 126 thousand, up by 11.2%. General hospitals and health centres in the province possessed 296 thousand beds, up by 10.6%.
There were carried out 3,255 times or items
of popular fitness projects throughout the province and 2369 million people
usually participated in physical exercises. The number of administrative
village which newly built farmer sports fitness projects was 1506. The athletes
of
XI. Population, Living Conditions and Social Security
By the end of 2013, the resident population
of
Table 10: Resident Population and Its Composition, 2013
|
Item |
Population |
Proportion
(%) |
|
Resident Population
|
6690.6 |
100.00 |
|
Of which: Urban |
3208.8 |
47.96 |
|
Rural |
3481.8 |
52.04 |
|
Of which: Male |
3451.5 |
51.59 |
|
Female |
3239.1 |
48.41 |
|
Of which: Aged 0-14 |
1213.7 |
18.14 |
|
Aged 15-59 |
4397.8 |
65.73 |
|
Aged 60-plus |
1079.1 |
16.13 |
|
Of which: Aged 65-plus |
708.4 |
10.59 |
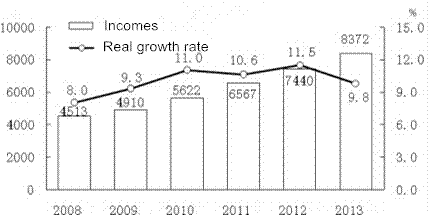
The average per capita disposable incomes reached 23,414 yuan for city dwellers, up by 9.8%, or a real increase of 7.0% over the previous year without the factor of price increase. The average per capita net income reached 8,372 yuan for rural residents, up by 12.5%, or a real increase of 11.5% over the previous year without the factor of price increase. The average per capita consumption expend of city dwellers reached 15,887 yuan, up by 8.7%. The average per capita consumption expend of rural residents reached 6,609 yuan, up by 12.6%. The average per capita food expenses occupied 58.8 percent of the total consumption expenditure (the Engel coefficient) for city dwellers, while it occupied 38.4% for rural residents.
Figure 5: The average per capita disposable incomes of city dwellers and the real growth rates, 2008-2013
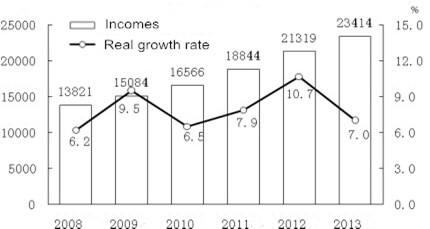
Figure 6: The average per capita net incomes of rural residents and the real growth rates, 2008-2013
The newly-added employed people in urban
areas were 801 thousand. At the end of 2012, a total of 10,917 thousand people
participated in basic pension program, a year-on-year increase of 436 thousand.
Of this total, 7,623 thousand were staff and workers, and 3,295 thousand were
retirees. A total of 23,162 thousand people participated in urban basic health
insurance program. Of which, 7,993 thousand people participated in urban basic
health insurance program for staff and workers, and 15,170 thousand people
participated in health insurance program for residents. Some 4,617 thousand
people participated in unemployment insurance program, an increase of 118
thousand. A total of 7,310 thousand people participated in work accident
insurance, an increase of 372 thousand. A total of 5,358 thousand people
participated in maternity insurance program. A total of 33.81 million people
participated in new pension insurance program for rural residents. A total of
47.29 million people (not including
XII. Resources, Environment and Work Safety
144 kinds of ores have been found, and reserves of 109 kinds of ores have been proved. Implementation of geological explorations projects (including continue projects) were 434.Implementation of old mines deep edge prospecting projects were 30. A total of 15 new mineral deposits in large or medium size were discovered. There were 12 National Geology Park and 4 geological sites.Implementation of comprehensive land improvement project above the provincial level were 124,and land consolidation had 146.0 thousand hectares.
In urban areas, 89.0% of waste water was put under centralized processing systems, up by 3.2%, and 98.4% of solid waste from daily life was processed under nontoxic programs, up by 2.7%. 9 cities and A.P. met the air quality standard Grade Ⅱ. The rate of surface water monitoring cross sections which met the standard Grade III was 89.9%. There were 1256.0 thousand hectares of 120 natural reserves, including 19 national ones and 28 provincial ones. A total of 404.0 thousand hectares of forest in the barren hills and waste (sand) land were planted.Meanwhile,comprehensive land recovery program was applied to about 50,000 square kilometers of once eroded areas. At the end of the year, there was afforested area of closed off mountain (sand) 1656.0 thousand hectares. The forest coverage rate reached 57.52%, up by 0.18% points over the previous year.
Preliminary estimation indicated that the total energy consumption in 2013 amounted to 67.34 million tons of standard coal equivalent, up by 2.4% over the previous year. Of which, the total energy consumption for the major six high energy consuming industries was 53.13 million tons of standard coal equivalent, up by 3.9%. In industrial enterprises, consumption of raw coal rose by 62.3 percent,consumption of crude oil rose by 2.2%, consumption of gas rose by 10.6%, and consumption of coke dropped 1.7%. Energy consumption of ten-thousand-yuan industrial enterprises has increased by 0.73 tons of standad coal equivalent. Chemical demanding of oxygen, the emission of sulfur dioxide, ammonia nitrogen and nitrogen and oxides decrease by 3.2%, 5.9% and 8.9% respectively.Comprehensive utilization rate of industrial solid wastes was 65%. Noise compliance rate of city function zones during the day was 90.4%, up by 2.3% over the previous year; Noise compliance rate during the night was 74.7%, up by 3.5%.
There were total of 5855 various kinds of work accidents in the province, down by 4.1%. The death from work accidents was 1069 persons, down by 19.9%. The death toll from work accidents every 100 million yuan worth of GDP was 0.10 people, down by 15.4%. Work accidents in industrial, mining and commercial enterprises caused 1.25 deaths out of every 100 thousand employees, down by 16.7%. The death toll for producing on million tons of coal in coalmines was 1.32 persons, down by 21.0%. The year 2013 witnessed 8698 traffic accidents, down by 0.7%. The road traffic death toll per ten thousand vehicles was 2.15 persons, down by 6.5%.
Notes:
1. All figures in this Communiqué are preliminary statistics.
2. Gross domestic product (GDP) and value added as quoted in this Communiqué are calculated at current prices, whereas their growth rates are at constant prices.
3. The original premium income received by the insurance companies refers to the premium income from original insurance contracts confirmed by the insurance companies.
4. The enrollment rate of primary school age children refers to the percentage of the enrolled school-age children contributing to the total number. of School-age Children.
5. Gross enrollment rate of senior secondary school education mostly reflects the coverage of senior secondary school education, referring to the percentage of senior high school students contributing to the NO. of school age population who are around 15-17.
6. Resident population of a given town/street include: people living in the current town/street where their household registration is located or with their household registration to be settled; people living in the current town/street and leaving the town/street of their household registration for over 6 months; people leaving the town/street of their household registration for less than 6 months or working or studying overseas, with their household registration located in the current town/street.
7. The figures of energy consumption are verified initially by National Bureau of Statistics of China.
Source:
In this communique, fiscal data are from the Financial Department of Hunan Province. Goods’ Prices, the income and expenditure of urban and rural residents, the Engel’s coefficient and data in the agricultural section are from the NBS Survey Office of Hunan Province; data about the traffic volume and the turnover volume of passengers and cargo in railway are from Shichang Railway Co. Ltd., Guangzhou Railway (group) Company and Nanchang Railway Administration; Data about the traffic volume and the turnover volume of passengers and cargo in highway are from the Road Transport Bureau of Hunan Province; Data about the traffic volume and the turnover volume of passengers and cargo in civil aviation are from the Airport Management Co. Ltd of Hunan Province; Data about Telecommunications business, mobile phone users, fixed telephone users, broadband Internet users are from the Telecommunications Company of Hunan Province, the Mobile Company of Hunan Province, the Unicom Company of Hunan Province, the Tietong Company of Hunan Province; Data about postal business are from the Postal Administration of Hunan Province; Travel data are from the Tourism Bureau of Hunan Province; Data about adeposits and loans are from Changsha Central Sub-branch of the People's Bank of China; Data about quoted company are from the people's Government Finance Office of Hunan Province; Data about negotiable securities are from Hunan Regulatory Authority of China Securities Regulatory Commission. Insurance data are from the Hunan Regulatory Authority of China Insurance Regulatory Commission; Education data are from the Education Department of Hunan Province; Data about science and technology are from the Science and Technology Department of Hunan Province; Patent data from the Intellectual Property Office of Hunan Province; Data about quality inspection, industry standard are from the Bureau of Quality and Technical Supervision of Hunan Province; Data about mineral resources, geological parks and monuments of surveying and mapping are from the Land and Resources Ministry of Hunan Province; Data about art performing groups, museums, public libraries, cultural centers, non-material cultural heritage protection are from the Cultural Department of Hunan Province; Data about radio and television are from the Bureau Radio and Television of Hunan Province; Data newspapers, periodicals, book are from the Press and Publication of Hunan Province; Data about hygiene and the new rural cooperative are from the Hygiene Bureau of Hunan Province; Data about sports are from the Sports Bureau of Hunan Province; Data about urban jobs and social security are from Human Resources and Social Security Department of Hunan Province; Data about insurances providing for urban and rural low-income people, social welfare, community service, nursing homes and social donation are from the Department of Civil Affairs of Hunan Province; Data about helping the poor and needy with developing production are from Poverty Relief Office of Hunan Province; Data about Soil Erosion Control and rural drinking water safety are from the Water Resources Bureau of Hunan Province; Data about rural dangerous houses reconstruction, sewage and garbage disposal are from the Housing and Construction Department of Hunan Province; Data about nature reserve, silver culture, forest cultivation, standing forest stock and forest coverage are from the Forestry Department of Hunan Province; Data about the quality of air and surface water, pollutant emission, utilization of industrial solid wastes and noise of standard are from the Environmental Protection Bureau of Hunan Province; Data about safe production are from the Work safety Administration of Hunan Province; all the other data are from Bureau of Statistics of Hunan Province.