Hunan Province Statistical Communiqué for the 2016
National Economic and Social Development
Hunan Bureau of Statistics
March 7, 2017
In 2016, in face of downward pressure on the economy, Hunan Provincial Committee and Hunan Provincial Government firmly carried out decisions from the CPR Central Committee, fully implemented new development strategy, adhered to general work guideline of making progress while maintaining stability, gave particular emphasis to structural reform on the supply side, and worked to stable growth, further reform, structural adjustments and people’s wellbeing and against risks. With these efforts, the economic development was stable and growing, being off to a good start in "Thirteen-Five".
I. General Outlook
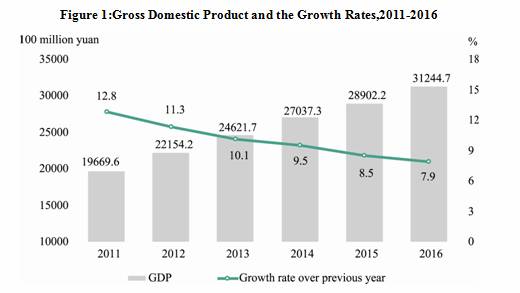
In 2016, after preliminary accounting, Hunan’s gross domestic product (GDP) for the year was 3,124.47 billion Yuan, up by 7.9% over the previous year. Out of this total, the added value of the primary industry was 357.84 billion Yuan, up by 3.3%, that of the secondary industry was 1,318.10 billion Yuan, up by 6.6% and the tertiary industry was 1,448.53 billion Yuan, up by 10.5% rise. Calculated over permanent population, the Per Capita GDP turned out to be 45,931 Yuan, up by 7.3%.
The proportion of the three industries in Hunan Province was calculated as 11.5:42.2:46.3. The operation revenue of service industry above designated size was 257.72 billion Yuan, up by 18.3% over the previous year, and its profits was 24.35 billion Yuan, up by 12.1%. The tertiary industrial proportion increased by 2.1 percentage points over the previous year. The added value of the secondary industry accounted for 35.8% of Hunan’s GDP, down by 2.1 percentage points over the preceding year. The added value of the high and new technology industry accounted for 22.0%, up by 0.8 percentage points over the preceding year. The added value of non-public sectors of the economy was 1,873.99 billion Yuan, up by 8.7%. And it accounted for 60.0% of Hunan’s GDP, up by 0.4 percentage points over the previous year. The added value of strategic emerging industry was 349.92 billion Yuan, up by 9.4%, accounting for 11.2% of Hunan’s GDP. The contribution rate of the primary, secondary and tertiary industry to economic growth was 4.8%, 37.0% and 58.2% respectively. Of the total, the contribution rate of tertiary industry increased by 4.3 percentage points. The contribution rate of industrial added value to economic growth was 31.6%, and that of the added value of product services to economic growth was 20.0%. The contribution rate of the gross capital formation, final consumption expenditure and net outflow of goods and services to economic growth was 49.5%, 52.7% and -2.2% respectively
Looking from regions, the GDP of Changsha-Zhuzhou-Xiangtan (CZT) region was 1,368.19 billion Yuan, up by 9.0% over the previous year; The GDP of south Hunan was 660.96 billion Yuan, up by 8.0%; The GDP of large western Hunan was 534.56 billion Yuan, up by 7.8%; The GDP of Dongting Lake areas was 754.06 billion Yuan, up by 7.8%.
II. Agriculture
In primary industry, the added value of farming was 227.66 billion Yuan, up by 3.6%; that of forestry was 23.78 billion Yuan, up by 8.2%; animal husbandry was 80.54 billion Yuan, down by 0.1%; and fishery was 25.86 billion Yuan, up by 6.5%.
The sown grain area was 4,891,000 hectares, a decrease of 1.1% compared with that in the previous year; for cotton the area was 104,000 hectares, down by 8.9%; sugar crops was 13,000 hectares, an increase of 1.1%; oil-bearing crops was 1,438,000 hectares, down by 0.5%; and the sown area of vegetables was 1,420,000 hectares, up by 3.5%.
The total output of grain in 2015 was 29,531,000 tons, decreased by 1.7% over the previous year; that of oil-bearing crops kept the same, that of cotton decreased by 15.2%, that of flue-cured tobacco, tea, vegetables increased by 2.5%, 5.9%, 5.0% respectively; meat decreased by 2.6%; milk increased by 4.1%; aquatic products increased by 4.0%; and eggs increased by 3.2%.
Over 28,000 hectares of farmland owing to effective irrigation systems was increased, up by 37.0% over the previous year; additional 19,000 hectares of farmland was guaranteed by water-saving irrigation systems; there were 75,000 water conservancy projects under construction with an investment of 29.20 billion Yuan, while a total area of 1,060 million cubic meters of earth and stone was covered; and 10,588 kilometers of rural highway was built.
III. Industry and Construction
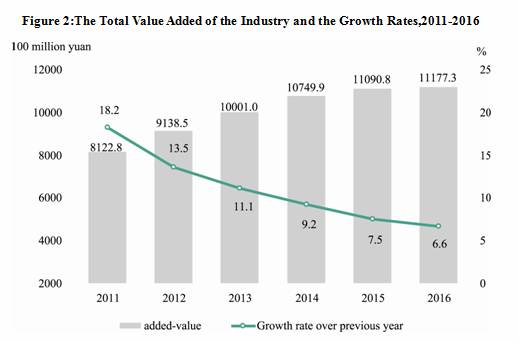
The total added value of the industry sector was 1,117.73 billion Yuan, a year-on-year increase of 6.6%. The value added of industrial enterprise above designated size grew by 6.9%. The output value for new products of industrial enterprise above designated size increased by 8.7%, taking up 77.0% of industrial total value, 1.4 percentage points higher than the previous year. The added value of high-processing industries and high-tech manufacturing industries rose by 10.6% and 11.4%, taking up 38.0% and 11.2% of the above-scale industrial added value respectively, 0.8 percentage points and 0.7 percentage points higher than that of the previous year. The growth of value added of non-public industrial enterprise above designated size reached 9.4%, taking up 65.7% of the industrial enterprise above designated size, 4.2 percentage points higher than the previous year. The growth of the added value for six major high energy consuming industries was 5.1%, accounting for 30.6% of industrial enterprise above designated size, 0.3 percentage points higher than that of the previous year. In terms of regions, the value added of industrial enterprise above designated size in Changsha-Zhuzhou-Xiangtan(CZT) areas, southern Hunan, western Hunan and Dongting Lake areas grew by 7.3%, 6.6%, 6.4% and 6.6% respectively.
In the statistics about products of the industrial enterprises above designated size, 58.8% of industrial products increased. In terms of the main products, the output of rice was 14.515 million tons, up by 5.8%; the output of fodder was 18.197 million tons, up by 6.0%; the output of crude processing volume was 8,406 thousand tons, an decrease of 4.2%; the output of cement reached 121.777 million tons, an increase of 3.9%; the output of rolled steel was 19.987 million tons, up by 3.6%; the output of ten kinds of non-ferrous metal was 2.267 million tons, a decrease of 14.5%; the output of concrete machineries totaled 40 thousand, down by 9.3%; the output of cars was 741 thousand, up by 30.8%; and the electric energy production was 128.47 billion kilowatt-hours, an increase of 4.5%.
Table 1: Outputs and Growth Rates of Major Products in Industries above Designated Size, 2016
|
Product |
Unit |
Output |
Increase over 2015 (%) |
|
Crude Salt |
10,000 tons |
282.6 |
7.4 |
|
Rice |
10,000 tons |
1451.5 |
5.8 |
|
Feedstuff |
10,000 tons |
1819.7 |
6.0 |
|
Edible Vegetable Oil |
10,000 tons |
388.2 |
6.0 |
|
Cigarette |
100 million |
1694.6 |
-3.6 |
|
Machine-made Paper and Paperboard |
10,000 tons |
422.1 |
-4.9 |
|
Crude Processing Volume |
10,000 tons |
840.6 |
-4.2 |
|
Sulfuric Acid(converted into 100%) |
10,000 tons |
240.7 |
1.1 |
|
Caustic Soda(converted into 100%) |
10,000 tons |
43.0 |
-10.7 |
|
Synthetic Ammonia |
10,000 tons |
74.4 |
-29.4 |
|
Fertilizers(converted into pure) |
10,000 tons |
102.8 |
1.0 |
|
Cement |
10,000 tons |
12177.7 |
3.9 |
|
Plate Glass |
10,000 weight cases |
2739.1 |
25.3 |
|
Pig Iron |
10,000 tons |
1791.4 |
1.7 |
|
Crude Steel |
10,000 tons |
1827.8 |
0.9 |
|
Rolled Steel |
10,000 tons |
1998.7 |
3.6 |
|
Ten kinds of Nonferrous Metals |
10,000 tons |
226.7 |
-14.5 |
|
Silver |
tons |
9328.3 |
9.4 |
|
Jack-up Equipment |
10,000 tons |
56.9 |
-18.9 |
|
Concrete Machinery |
10,000 units |
4.0 |
-9.3 |
|
Motor Vehicles |
10,000 units |
74.1 |
30.8 |
|
Of which: Car |
10,000 units |
28.9 |
-3.7 |
|
SUV |
10,000 units |
33.1 |
193.8 |
|
Power Generating Equipment |
10,000 kilowatts |
156.6 |
-17.8 |
|
AC Electric Motor |
10,000 kilowatts |
1412.2 |
-1.6 |
|
Transformer |
10,000 KVA |
10958.2 |
1.7 |
|
Electricity |
100 million kilowatt-hours |
1284.7 |
4.5 |
|
Of which: Thermal power |
100 million kilowatt-hours |
722.6 |
1.5 |
|
Hydropower |
100 million kilowatt-hours |
530.4 |
6.7 |
The total profit of industrial enterprises above designated size was 162.05 billion Yuan, up by 4.5% compared with last year. Grouped by ownership, the profits of the state-owned enterprises were 11.37 billion Yuan, a decrease of 12.6%; those of the collective enterprises were 0.89 billion Yuan, down by 12.8%; those of the share collaboration enterprises were 170 million Yuan, down by 50.7%; those of the share-holding enterprises were 124.94 billion Yuan, an increase of 6.0%; those of the enterprises by foreign investors and investors from Hong Kong, Macao and Taiwan was 14.11 billion Yuan, up by 12.8%; those of other domestic-funded enterprises were 10.57 billion Yuan, up by 2.2%. Among the industrial sectors whose profits was in the top five, the profits of manufacture of non-metallic mineral products were 14.81 billion Yuan, up by 10.7%; the profits of manufacture of raw chemical materials and chemical products were 13.24 billion Yuan, down by 5.1%; the profits of agricultural food processing industry were 12.72 billion Yuan, up by 2.1%; the profits of manufacture of cigarette were 9.04 billion Yuan, down by 19.5%; and the profits in Computer, communication and other electronic equipment manufacturing industry were 9.00 billion Yuan, up by 20.3%.
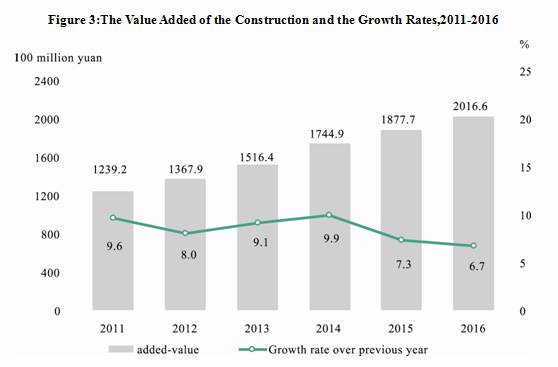
The added value of construction enterprises was 201.66 billion Yuan, up by 6.7% over last year. The profits made by general contracting and specialized contracting construction enterprises with qualification reached 23.96 billion Yuan, up by 6.8%. The floor space of building under construction was 503.275 million square meters, up by 5.9%. The floor space of building completed was 186.292 million square meters, up by 7.1%.
IV. Investment in Fixed Assets
The provincial investment in fixed assets (excluding rural households) increased by 13.8% to 2,768.85 billion Yuan. Of the total, private investment in Hunan totaled 1,638.13 billion Yuan with a year-on-year growth of 3.8%, accounting for 59.2% of the provincial investment in fixed assets. Grouped by ownership, the investment of state-owned units was 925.35 billion Yuan, up by 23.9%, and the investment of non-state-owned units was 1,843.49 billion Yuan, up by 9.4%. Grouped by investment orientation, the investment for people's livelihood was 267.46 billion Yuan, up by 46.4%; that of ecology was 124.67 billion Yuan, up by 29.3%; that of infrastructure was 734.99 billion Yuan, up by 26.2%; that of high and new technology industries was 177.44 billion Yuan, up by 19.7%; that of technical innovation was 719.60 billion Yuan, down by 0.1%; and that of strategic emerging industries was 639.60 billion Yuan, up by 17.5%. Grouped by region, the investment of Changsha-Zhuzhou- Xiangtan areas, southern Hunan, western Hunan and Dongting Lake areas was 1,097.74 billion Yuan, 626.26 billion Yuan, 459.86 billion Yuan and 564.00 billion Yuan respectively, and grew by 13.9%, 14.0%, 14.1% and 14.5% respectively.
The province's total number of construction projects was 49,962, up by 4.8%; the number of the projects that were undertaken this year was 40,912, up by 4.3%; and the number of the projects that were put into operation this year was 33,375, down by 5.8%. The investment in province’s real estate development was 295.70 billion Yuan, up by 13.1% compared with the previous year. Of this total, the investment in residential buildings was 187.13 billion Yuan, up by 3.8%. The floor space of commercialized buildings sold was 80.854 million square meters, an increase of 27.1%. Of which, the floor space of residential buildings sold was 71.907 million square meters, an increase of 26.8%. The total sale of commercialized buildings was 375.19 billion Yuan, up by 37.0%. Of which, the sale of residential buildings was 311.36 billion Yuan, up by 38.1%. Commercial house area for sale was 29.015 million square meters, down by 12.3%, a decrease of 4.081 million square meters over the previous year.
Table 2: Fixed Assets Investments and Growth Rates,2016
|
Index |
Investment (100 million Yuan) |
Increase over 2015 (%) |
|
Fixed Assets Investment (Excluding Rural Households) |
27688.5 |
13.8 |
|
Primary Industry |
1000.8 |
11.6 |
|
Secondary Industry |
10567.8 |
6.3 |
|
Of which: Mining Industry |
499.5 |
-12.4 |
|
Manufacturing Industry |
8824.5 |
7.9 |
|
Production and Supply of Electricity, Heat, Gas and Water |
950.8 |
18.1 |
|
Construction Industry |
318.7 |
-24.9 |
|
Tertiary Industry |
16119.9 |
19.5 |
|
Of which: Transportation, Warehousing and Postal Service |
1944.4 |
16.7 |
|
Information Transmission, Software and IT Service |
298.3 |
8.0 |
|
Wholesale and Retail Sale |
1104.8 |
-5.9 |
|
Hotels and Catering Service |
293.9 |
-7.0 |
|
Financial Industry |
78.6 |
-30.2 |
|
Real Estate |
4369.5 |
21.9 |
|
Leasing and Commercial Service |
723.4 |
34.9 |
|
Scientific Research and Technological Service |
358.2 |
16.9 |
|
Management of Water Conservancy, Environment and Public Facilities |
4526.2 |
32.6 |
|
Residents Service, Repair and Other Services |
131.0 |
0.9 |
|
Education |
568.1 |
18.1 |
|
Sanitation and Social Work |
414.3 |
42.2 |
|
Culture, Sport and Entertainment |
512.8 |
79.1 |
|
Public Management, Social Security and Social Organization |
539.9 |
-20.5 |
V. Domestic Trade and Price
In 2016, Hunan’s total retail sales of consumer goods reached 1,343.65 billion Yuan, a growth of 11.7% over the previous year. An analysis of several areas showed that the retail sales of consumer goods in urban areas stood at 1,214.66 billion Yuan, up by 11.6%, and that in rural areas reached 128.99 billion Yuan, up by 13.1%. In terms of regions, the total retail sales of consumer goods in Changsha-Zhuzhou-Xiangtan (CZT) zone, southern Hunan, western Hunan and Dongting Lake areas was 563.83 billion Yuan, 262.30 billion Yuan, 233.31 billion Yuan and 284.22 billion Yuan respectively, a year-on-year growth of 11.6%, 11.8%, 11.8% and 11.9%.
Table 3: Retail Sales and Growth Rates of Social Consumer Goods, 2016
|
Index |
Retail Sale (100 million Yuan) |
Increase over 2015 (%) |
|
Total Retail Sale of Consumer Goods |
13436.5 |
11.7 |
|
Grouped by Location |
|
|
|
Of which: Town |
12146.6 |
11.6 |
|
Village |
1289.9 |
13.1 |
|
Retail Sale of Above-norm Corporate Wholesale and Retailing Merchandise |
4999.1 |
12.9 |
|
Of which: Grain and Oils, and Food |
491.8 |
17.8 |
|
Beverages and Alcohols |
94.1 |
15.7 |
|
Tobaccos |
144.1 |
18.7 |
|
Clothing, Shoes, Hats, Textiles |
350.3 |
10.0 |
|
Cosmetics |
50.6 |
0 |
|
Silver and Jewelry |
76.3 |
3.3 |
|
Daily Commodity |
159.8 |
17.8 |
|
Hardware and Electrical Materials |
59.3 |
18.7 |
|
Sports and Recreation Articles |
11.4 |
0.4 |
|
Newspapers and Magazines |
38.6 |
64.8 |
|
Electronic Publications and Audio and Video Products |
3.7 |
11.2 |
|
Household Appliances and Audio and Video Accessories |
340.8 |
10.8 |
|
Traditional Chinese and Western Medicines |
320.1 |
19.1 |
|
Culture and Office Articles |
72.6 |
19.2 |
|
Furniture |
39.4 |
54.2 |
|
Communication Appliances |
50.8 |
20.0 |
|
Coal and Related Products |
65.7 |
12.8 |
|
Petroleum and Related Products |
782.5 |
2.9 |
|
Building and Decoration Materials |
91.5 |
37.3 |
|
Mechanical and Electrical Products |
47.8 |
13.1 |
|
Automobiles |
1586.5 |
15.1 |
The retail sales of the legal entities’ wholesale and retail industry above designated size was 499.91 billion Yuan, up by 12.9% over the previous year. Of that total, the retail sales of cultural, recreational, sporting and healthy merchandise increased by 21.4%. By types of commodity, the retail sales of grain, oil, and food increased by 17.8%; that of newspapers and magazines increased by 64.8%; that of household appliances and audiovisual equipment increased by 10.8%; that of cultural and official goods increased by 19.2%; that of Communication Appliances increased by 20.0%; that of Building and Decoration Materials increased by 37.3%; and that of cars increased by 15.1%.
The consumer prices index (CPI) of household in Hunan was 1.9% higher than the previous year, of the which in urban area grew by 1.9%, while in rural area grew by 1.9%. The retail prices of commodities decreased by 1.0%. The producer price index (PPI) drop by 1.1% and IPI drop by 2.0%. The prices for investment in fixed assets grew by 0.4%. The producer prices of farm products grew by 4.7%. The prices for means of agricultural production grew by 1.7%.
Table 4: The Change Rate of Consumer Prices compared with 2016
|
Index |
Increase over 2015(%) |
|
CPI (Consumer Price Index) |
1.9 |
|
Of which: Food |
4.3 |
|
Tobacco and Articles |
1.5 |
|
Clothing |
1.2 |
|
Household Appliances and Maintenance Services |
0 |
|
Health Care and Personal Items |
-1.6 |
|
Traffic and Telecommunications |
0.8 |
|
Recreation, Education and Cultural Articles and Services |
3.1 |
|
Residence |
1.6 |
VI. International Economics / Trade
Hunan’s total imports and exports were worth 178.22 billion Yuan, a decrease of 2.1% compared with the previous year. Of the total, the exports were 120.53 billion Yuan, up by 1.5% and the imports were 57.70 billion Yuan, down by 8.9%. In terms of types of trade, the exports of general trade were 88.30 billion Yuan, up by 21.3%, and the exports of processing trade totaled 30.26 billion Yuan, down by 22.7%. by the types of commodities, the exports of garments and accessories were 7.66 billion Yuan, up by 51.6%; that of steel were 4.95 billion Yuan, down by 18.0%; that of silver were 3.97 billion Yuan, down by 5.9%; that of ceramics for household purpose steel were 2.38 billion Yuan, up by 5.6%. In terms of region, the exports to Hong Kong reached 30.73 billion Yuan, down by 7.5%; the exports to America reached 17.43 billion Yuan, up by 26.5%; the exports to European Union were 15.51 billion Yuan, up by 40.0%; and the exports to Japan were 2.80 billion Yuan, up by 11.5%.
The foreign capital actually utilized was 12.85 billion dollars, up by 11.1%. Of which, the foreign capital in the primary industry was 620 million dollars, down by 0.4%; the foreign capital in the secondary industry was 6.86 billion dollars, down by 4.0%; and the foreign capital in the tertiary industry was 5.37 billion dollars, up by 41.5%. There were 10 foreign-funded projects whose actually installed capital was over 30 million dollars approved. 2 enterprises of the world top 500 were newly introduced in Hunan, and the number reached 140 by the end of 2016. The actually utilized capital out of the province and inside China was 436.18 billion Yuan, up by 15.0%. Of which, the actually utilized capital of the primary industry, the secondary industry and tertiary industry was 29.04 billion Yuan (up by 50.4%), 220.40 billion Yuan (up by 5.9%) and 186.73 billion Yuan (up by 23.1%) respectively. There were 424 projects above 200 million Yuan, up by 22.9%, and the actually installed capital was 156.33 billion Yuan, up by 21.3%.
Table 5: Total Exports and Imports and Growth Rate, 2016
|
Index |
Absolute Number (100 million Yuan) |
Increase over 2015 (%) |
|
Total Imports and Exports |
1782.2 |
-2.1 |
|
Exports |
1205.3 |
1.5 |
|
Grouped by Mode of Trade |
|
|
|
Of which: Original Trade |
883.0 |
21.3 |
|
Processing Trade |
302.6 |
-22.7 |
|
Grouped by Main Commodity |
|
|
|
Of which: Electromechanical Products |
565.3 |
-8.9 |
|
High-tech Products |
175.6 |
-22.0 |
|
Agricultural Products |
69.0 |
5.7 |
|
Imports |
577.0 |
-8.9 |
|
Grouped by Mode of Trade |
|
|
|
Of which: Original Trade |
381.3 |
15.2 |
|
Processing Trade |
175.9 |
-22.7 |
|
Grouped by Main Commodity |
|
|
|
Of which: Electromechanical Products |
268.6 |
-15.2 |
|
High-tech Products |
101.2 |
-37.2 |
|
Agricultural Products |
32.5 |
52.2 |
The value in new contracts signed through contracted projects, labor contracts and design consultation contracts reached 6.60 billion dollars, up by 11.6%. The accomplished turnover was 6.31 billion dollars, up by 22.0%. The expatriate labors reached 96 thousand, up by 17.8%. The investment in contracts were 4.70 billion US dollars, up by 51.7%. Of which domestic side were 3.35 billion US dollars, up by 20.6%. Foreign actual investment were 1.65 billion US dollars, up by 11.5%.
VII. Transportation, Post and Telecommunications and Tourism
Hunan’s converted turnover volume of passenger and freight transportation reached 505.25 billion ton-km, an increase of 4.1%. The total turnover volume of freight transport was 405.68 billon ton-km, a year-on-year increase of 4.0%. Of the total, goods transported via rail were 73.50 billion ton-km, a decrease of 2.1%, and that by road was 268.66 billion ton-km, increasing by 5.2%. The total turnover volume of passenger traffic was 166.93 billion person-km, a 1.1% increase. Of the total, passengers travelling by rail increased to 92.44 billion person-km, 5.0% higher than the previous year; passengers travelling by road were 57.70 billion person-km, down by 9.2%; and that utilizing civil aviation reached 16.47 billion person-km, increasing by 24.5%.
At the end of the year, the province's mileage in highway open to traffic reached 238 thousand kilometers, up by 0.6%. Of the total, the mileage in expressway open to traffic was 6,080 kilometers, an increase of 428 kilometers. The length of railway in operation reached 4,716 kilometers. Of which, express railway measured 1,374 kilometers long. The total number of the civil automobile in province reached 6.030 million by the end of 2016, up by 16.7%. The number of private vehicles was 5.511 million, up by 18.2%. The number of cars was 3.281 million, up by 18.4%.
Table 6: Volume of Passenger and Freight Transportation by Various Means and Growth Rate, 2016
|
Index |
Unit |
Absolute Number |
Increase over 2015(%) |
|
Volume of Freight Traffic |
10,000 tons |
207365.1 |
3.4 |
|
Of which: Railway |
10,000 tons |
3925.9 |
-5.9 |
|
Highway |
10,000 tons |
178967.7 |
3.9 |
|
Waterway |
10,000 tons |
23444.6 |
1.7 |
|
Civil Aviation |
10,000 tons |
6.4 |
5.4 |
|
Pipeline |
10,000 tons |
1020.4 |
4.0 |
|
Volume of Passenger Traffic |
10,000 people |
122643.3 |
-7.2 |
|
Of which: Railway |
10,000 people |
11310.5 |
9.1 |
|
Highway |
10,000 people |
108627.4 |
-8.9 |
|
Waterway |
10,000 people |
1614.8 |
5.3 |
|
Civil Aviation |
10,000 people |
1090.5 |
16.6 |
The total value of post and telecommunications amounted to 134.79 billion Yuan, up by 50.8% compared with the previous year. Among them, the value of mail service totaled 14.34 billion Yuan, up by 37.7%, and that of teleservice reached 120.45 billion Yuan, a growth of 52.6%. The number of mobile phone and fixed telephones users was 49.091 million (an increase of 1.0%) and 6.827 million (a decrease of 13.3%) respectively by the end of the year. The Internet broadband users totaled 10.442 million, an increase of 17.4%.
As for tourism, Hunan received 560 million domestic tourists (a 19.5% increase) and 2.408 million inbound tourists (a 6.5% increase) respectively. The total revenue of tourism was 470.74 billion Yuan, increasing by 26.8%. Of the total, domestic revenue, marking a 26.8% growth, reached 464.07 billion Yuan, while foreign exchange earnings, marking a 17.1% increase, grew to 1.01 billion dollars.
VIII. Finance and Insurance
Hunan's total revenue of general public budget reached 425.21 billion Yuan, up by 6.0% compared with the previous year. Local revenue was 269.79 billion Yuan, up by 7.3%. Of the total, tax revenue and nontax revenue reached 155.13 and 114.66 billion Yuan, up by 1.6% and 16.1% respectively. Value-added tax and consumption tax revenue turned over to central government was 114.22 billion Yuan, approximate to the previous year. Income tax revenue turned over to central government was 37.11 billion Yuan, up by 6.7%. The total expenditure of general public budget totaled 633.70 billion Yuan, up by 10.6%, including that on social security and employment (88.24 billion Yuan, up by 13.2%), that on Urban and rural community affairs(68.38 billion Yuan, up by 24.0%), that on Culture, Sports and Media(15.50 billion Yuan, up by 38.7%), and that on Poverty alleviation(9.06 billion Yuan, up by 140.0%).
By the end of the year, deposit balances in RMB and other currencies reached 4199.67 billion Yuan, up by 15.9%. Of the total, deposit balances of household and non-financial enterprise were 2124.21 billion Yuan and 1228.09 billion Yuan, up by 13.0% and 24.6% respectively. Loan balances in RMB and other currencies reached 2753.23 billion Yuan, up to 13.7%. Of the total, loan balances of household and non-financial enterprise were 912.43 billion Yuan and 1834.23 billion Yuan, up by 17.2% and 12.3% respectively.
Table 7: Revenue and Expenditure of Public Finance and Growth Rate, 2016
|
Index |
Absolute Number (100 million Yuan) |
Increase over 2015 (%) |
|
Revenue of General Public Budget |
4252.1 |
6.0 |
|
Of which: Local Revenue |
2697.9 |
7.3 |
|
Of which: Tax Revenue |
1551.3 |
1.6 |
|
Nontax Revenue |
1146.6 |
16.1 |
|
Value-added Tax and Consumption Tax Revenue Turned over to Central Government |
1142.2 |
0 |
|
Income Tax revenue turned over to Central Government |
371.1 |
6.7 |
|
Expenditure of General Public Budget |
6337.0 |
10.6 |
|
Of which: General Public Service |
698.8 |
10.2 |
|
Education |
1011.5 |
8.9 |
|
Science and Technology |
71.4 |
7.7 |
|
Culture, Sports and Media |
155.0 |
38.7 |
|
Social Security and Employment |
882.4 |
13.2 |
|
Medical Service and Birth Control |
539.0 |
9.2 |
|
Energy Conservation and Environment Protection |
155.5 |
7.7 |
|
Urban and Rural Community Affair |
683.8 |
24.0 |
|
Agriculture, Forestry and Water |
698.7 |
2.3 |
|
Housing Security |
296.6 |
7.0 |
Table 8: Deposit and loan Balances of RMB and Overseas Currencies in Financial Institutions and
Added Balances, At the End of 2016
|
Index |
Balances (100 million Yuan) |
Added Balances over the beginning of 2016 (100 million Yuan) |
|
Total Deposit Balances |
41996.7 |
5776.1 |
|
Of which: Domestic Deposits |
41976.6 |
5789.3 |
|
Household |
21242.1 |
2441.4 |
|
Current Deposits |
8382.6 |
1186.4 |
|
Time Deposits and Other Deposits |
12859.6 |
1255.1 |
|
Non-financial Enterprise |
12280.9 |
2429.9 |
|
Current Deposits |
7313.1 |
2165.8 |
|
Time Deposits and Other Deposits |
4967.8 |
264.1 |
|
Non-banking Financial Institution |
1194.0 |
-181.0 |
|
Overseas Deposits |
20.2 |
-13.2 |
|
Total Loan Balances |
27532.3 |
3310.4 |
|
Of which: Domestic Loans |
27467.0 |
3340.5 |
|
Household |
9124.3 |
1338.4 |
|
Short-term Loans |
2197.7 |
55.9 |
|
Medium and Long-term Loans |
6926.6 |
1282.5 |
|
Non-financial Enterprise and Government Organization |
18342.3 |
2002.1 |
|
Short-term Loans |
4330.9 |
-102.8 |
|
Medium and Long-term Loans |
12720.9 |
1695.8 |
|
Overseas Loans |
65.3 |
-30.1 |
At the end of the year, the number of listed companies reached 104, with 5 new added during the whole year. Of the total, the domestic and the oversea listed companies was 88 and 16 respectively. The total amount of direct financing reached 314.71 billion Yuan, up by 27.6%. Of the total, the capital raised from share issuances and share placements totaled 22.16 billion Yuan. At the end of this year, there were 349 business departments of security companies in the province and 3 futures companies in the area under jurisdiction, whose turnover was 6,922.60 billion Yuan and 2,077.70 billion Yuan respectively.
The annual original premium incomes, marking a 24.5% increase, reached 88.65 billion Yuan. Of the total, incomes from life insurances, health insurances, life accident insurances and property insurances were 49.58 billion Yuan(a 27.4% increase), 9.54 billion Yuan(an increase of 59.0%), 2.23 billion Yuan(an increase of 12.6%) and 27.31 billion Yuan(an increase of 12.3%) respectively. Meanwhile, the total payment of original insurances was 34.00 billion, a growth of 32.2%.
IX. Education, Science and Technology
There were 108 regular institutions of higher learning at the end of the year. The number of graduates with a master degree associated with regular higher education was 19 thousand; that of graduates from university and specialized colleges was 317 thousand; and that of graduates from secondary technical schools was 200 thousand. The number of regular high school graduates, middle school graduates and regular primary school graduates was 342 thousand, 740 thousand and 770 thousand respectively. Enrollment of children in kindergarten totaled 224.9 million, a year-on-year increase of 3.8%. Enrolment rate of children in primary school hit 99.99%. Gross enrollment rate of teenagers in senior high school was 90.6%. As for the 12,702 non-government colleges and schools, the enrolled students were 2.665 million. There were 513 thousand college students funded by 0.90 billion Yuan state scholarships and grants for colleges and universities, 335 thousand vocational students supported by 370 million Yuan state grants for secondary vocational school, 970 thousand vocational students subsidized by 1.37 billion Yuan tuition-free grants for secondary vocational school. 8.61 billion Yuan were collected for the compulsory education guarantee fund and 430 million Yuan were granted to regular high school students.
Table 9: Number of New Students Enrollment, Students Enrollment and Graduates in
Schools at Different Levels and Growth rates, 2016
|
Index |
New Students Enrollment |
Students Enrollment |
Graduates |
|||
|
Absolute Number (10,000 eople) |
Increase over 2015(%) |
Absolute Number (10,000 people) |
Increase over 2015 (%) |
Absolute Number (10,000 people) |
Increase over 2015 (%) |
|
|
Post-graduate Education |
2.2 |
2.7 |
7.1 |
2.7 |
1.9 |
1.5 |
|
Regular Higher Education |
37.6 |
4.5 |
122.5 |
3.8 |
31.7 |
5.3 |
|
Adult Higher Education |
11.1 |
3.5 |
23.1 |
-4.7 |
11.8 |
12.4 |
|
Secondary Vocational Education |
25.1 |
5.7 |
66.1 |
2.0 |
20.0 |
-2.2 |
|
Regular Senior Secondary School |
39.4 |
3.6 |
110.9 |
3.2 |
34.2 |
2.1 |
|
Junior Middle Schools |
78.0 |
5.6 |
225.1 |
1.2 |
74.0 |
5.7 |
|
Regular Primary School |
90.0 |
1.5 |
501.8 |
2.6 |
77.0 |
5.4 |
|
Special Education |
0.5 |
17.8 |
2.6 |
14.2 |
0.3 |
88.2 |
In 2016, there were 4 national engineering research centers and 67 provincial engineering research centers. There were 16 national(combined with the local) engineering research centers and 164 national(combined with the local) engineering laboratories. The number of state validated enterprise technical centers reached 45. There were 14 national engineering technology research centers, 243 provincial engineering technology research centers, 16 national key laboratories, 164 provincial key laboratories. A total of 3,976 technology transfer contracts were signed, representing 10.56 billion Yuan in value. The number of registered scientific and technological achievements was 694, with 11 National Scientific and Technological Advancement Awards, 2 National Award for Technological Invention and 1 Natural Science Award.
Meanwhile, the average yield per mu of Super hybrid rice reached 1088 kilogram, recording the world's highest. A group of high-tech products including trains fully equipped with Permanent Magnet Traction System were developed. And a breakthrough was made in Xenogeneic Islet Transplantation Technology.
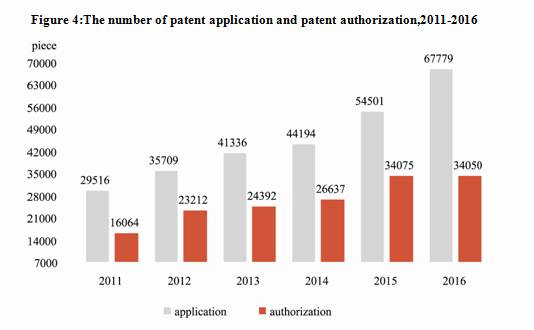
The number of patent applications was 67,779, a year-on-year rise of 24.4%. Of this total, 25,524 patent applications for original inventions were accepted, up by 30.9%. The number of authorized patents was 34,050, a year-on-year drop of 0.1%. Of which, there were 6,967 authorized patents for original inventions, up by 2.8%. The number of patent applications in industrial and mining enterprises, universities and colleges, and scientific research institutes reached 32343, 11973 and 783, while the number of patents authorized were 16723, 5881 and 369. The added value of new and high technology industries was 685.92 billion Yuan, up by 16.0%.
There were 1,665 testing and inspection agencies, and 23 of them were national product quality supervision and inspection centers. The number of authorized measurement institutions totaled 103. Production units for special equipment reached 1,685 with 274 thousand special equipment available. There were 5,485 batches of key industrial products checked, and 95.1% met the standard, an increase of 1.7 percentage point. A total of 21 international standard, 27 national standards and 245 local standards were developed respectively in the year. Land and resources departments published 47 types of maps and provided 239,000 achievements of geospatial data. And total visits to Map World reached 489,000.
X. Culture, Public Health and Sport
By the end of 2016, there were 273 art-performing groups, 143 mass art centers and culture centers, 137 public libraries, 113 museums and memorials, 13 radio broadcasting stations, and 15 television stations. The users of CATV reached 12.673 million. Broadcasting and television coverage rates were 94.57% and 98.26%, up by 0.51% and 0.28%. There were 118 state-level intangible cultural heritage protection projects and 324 provincial level protection projects in the province. All sorts of books were issued under 13,188 categories, with 248 types of magazines and 48 styles of newspapers. A total of 490 million copies of books were published, 140 million copies of magazines and 1.08 billion copies of newspapers were issued.
By the end of 2016, there were 61,055 health institutions in the province, including 1,260 hospitals, 139 maternal and child health-care institutions, 87 specialized health institutions, 2269 township hospitals, 715 community health service centers, 10,519 clinics and infirmaries, and 44,339 village clinics. There were 393 thousand health workers were installed, up by 5.9%. Among these health workers, there were 161 thousand practicing doctors and assistant practicing doctors, up by 6.5%; and 162 thousand registered nurses, up by 8.2%. The total of beds in hospitals was 300 thousand, up by 8.7%. And the total of beds in township hospitals was 96 thousand, up by 3.8%.
The province carried out 2,601 fitness programs for all people throughout the province with a participation of 23.996 million. The number of newly built administrative village of farmer sports fitness projects was 6,500. The athletes of Hunan province won 4 World Championships, 7 Asian Championship gold medals and 57 National Championships, breaking one world records. There were 98,684 sports fields, including 220 gyms, 7,296 sports grounds, 543 swimming pools, and 4,527 training rooms.
XI. Population, Living Conditions and Social Security
By the end of 2016, the permanent residents of Hunan province reached 68.220 million. Of the total, the population in cities and towns was 35.986 million, and urbanization rates was 52.75%, an increase of 1.86 percentage points. The annual newly-born population was 923 thousand with a birth rate of 13.57 ‰, and dead population was 477 thousand with a death rate of 7.01‰. The natural growth rate was 6.56‰. The population aged 0-15 (under 16) accounted for 19.71% of the permanent resident population, up by 0.14 percentage points; the population aged 16-59(under 60) accounted for 62.68%, down by 0.58 percentage points; and the population aged 60 and above accounted for 17.61%, up by 0.44 percentage points.
Table 10: Resident Population and its Composition, At the End of 2016
|
Index |
Number (10,000 people) |
Proportion (%) |
|
Resident Population |
6822.0 |
100 |
|
Of which: Town |
3598.6 |
52.75 |
|
Village |
3223.4 |
47.25 |
|
Of which: Male |
3517.6 |
51.56 |
|
Female |
3304.4 |
48.44 |
|
Of which: Aged 0-15 (under 16) |
1344.8 |
19.71 |
|
Aged 16-59 (under 60) |
4276.2 |
62.68 |
|
Aged 60 and Above |
1201.1 |
17.61 |
|
Of which: Aged 65 and Above |
801.5 |
11.75 |
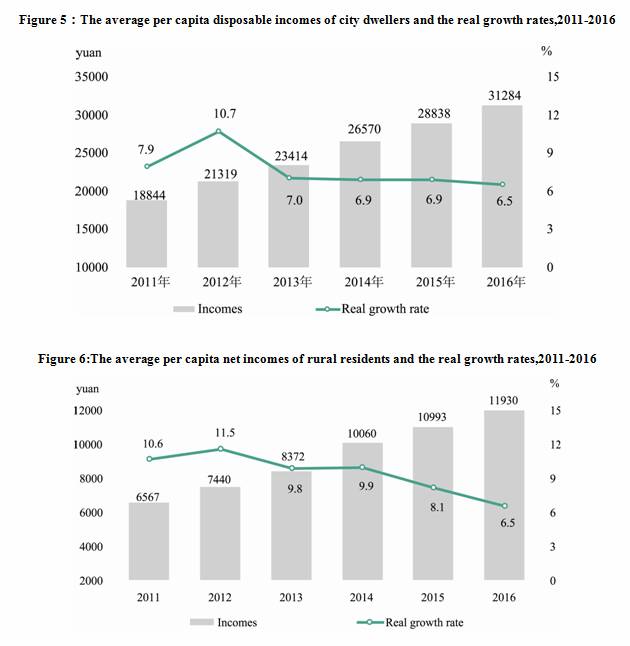
The province's per capita disposable income reached 21,115 Yuan, up by 9.3%, or a real increase of 7.3% over the previous year after deducting price factors, of which the median was 18,096 Yuan. Of the total, the per capita disposable income for urban dwellers was 31,284 Yuan, up by 8.5%, or a real increase of 6.5% after deducting price factors, of which the median was 29,064 Yuan, up by 6.8%; and that for rural residents was 11,930, up by 8.5%, or a real increase of 6.5% after deducting price factors, of which the median was 11,041, up by 10.1%. Moreover, the urban-rural income ratio remained 2.62:1, the same with the previous year. In terms of region, the per capita disposable income in Changsha-Zhuzhou-Xiangtan areas, southern Hunan, western Hunan and Dongting Lake areas was 33,236 Yuan, 19,698 Yuan, 14,198 Yuan and 19,225 Yuan respectively, up by 8.4%, 9.0%, 10.3% and 9.2%.
The province's per capita consumption expenditure reached 15,750 Yuan, up by 10.4%. That for urban dwellers and rural residents reached 21,420 Yuan and 10,630 Yuan respectively, up by 9.8% and 9.7% over the previous year. The proportion of expenditure on food to the total expenditure was 29.9% for urban dwellers and 31.7% for rural residents, down by 1.3 and 1.2 percentage respectively.
The newly-added employed people in urban areas were 774 thousand. At the end of 2016, a total of 12.039 million people participated in urban basic endowment insurance, a year-on-year increase of 432 thousand. Of the total, the insured employees and retirees was 8.111 million and 3.858 million respectively. A total of 26.461 million people participated in urban basic health insurance. Of the total, the number of insured staff and workers was 8.296 million, and that of the insured residents was 18.165 million. A total of 5.375 million staff and workers participated in unemployment insurance, an increase of 163 thousand. A total of 7.733 million staff and workers participated in work-related injury insurance and 5.429 million in maternity insurance. A total of 33.205 million people registered the new rural endowment insurance. A total of 60.832 million people participated in the new rural cooperative medical system, with a participation rate of 98.61%. At the end of the year, a total of 154 thousand staff and workers received the unemployment insurance payments. A total of 3.92 billion Yuan was dispensed for urban minimum subsistence allowance and 4.73 billion Yuan was dispensed for rural minimum subsistence allowance, supporting 1.118 million urban residents and 2.902 million rural residents respectively. Various types of Adopting Social Welfare Institutions provided 242 thousand beds, accepting 147 thousand inmates. There were 12,006 community service facilities set up in urban areas. Of them, the number of comprehensive community service centers was 6,035. A total of 8.54 billion Yuan worth of social welfare lottery was sold, raising 2.40 billion Yuan of social welfare funds. 176 thousand dilapidated houses in rural areas were renovated, 415 thousand urban shantytowns and 8.575 thousand state-owned mining shantytowns were transformed.
XII. Resources, Environment and Work Safety
A total of 144 minerals have been discovered in the province and the reserves of 109 minerals have been explored, including 7 energy minerals, 39 metal minerals, 61 non-metal minerals and 2 water and gas minerals. Implementation of geological explorations projects (including continue projects) were 208. A total of 5 new mineral deposits in large or medium size were discovered. A total of 18 key mining areas and 6 key minerals realized resources were integrated. There were 12 National Geology Park and 4 geological sites. Implementation of comprehensive land consolidation projects above province level were 233, and 76 thousand hectares of land was regulated.
In urban areas, the city sewage treatment rate and the treatment rate of solid waste were 94.3% and 99.8% respectively. The rate of actual surface water monitoring across sections which met the Grade III standard was 89.7%. A total of 191 natural reserves with an area of 1,368 thousand hectares was approved, including 22 state-level and 27 provincial-level reserves. In 2016, a total of 340 thousand hectares were reforested. At the end of the year, the area of closing hillsides to facilitate afforestation was 1,326 thousand hectares. And there were 530 million cubic meters of standing forest stock. The forest coverage rate reached 59.64%.
Preliminary estimation indicated that the comprehensive energy consumption of designed size enterprises amounted to 59.462 million tons of standard coal equivalent, a decrease of 1.5% compared with the previous year. Of which, the comprehensive energy consumption for the major six high energy consuming industries was 47.126 million tons of standard coal equivalent, a decrease of 1.7%. Among main pollutants, Chemical oxygen demand was 2.82 percent down on last year. And the emission of sulfur dioxide, ammonia nitrogen and nitrogen oxide also decreased by 8.42%, 3.07% and 6.99% respectively.
In 2016, a total of 2,202 accidents of the production and business were reported in the province. The death toll due to commercial production safety accidents amounted to 1589. The death toll from work accidents every 100 million Yuan worth of GDP was 0.05 people. Work accidents in industrial, mining and commercial enterprises caused 1.58 deaths out of every 100 thousand employees. The death toll in coalmines while producing one million tons of coal was 0.57. The year 2016 witnessed 7,505 traffic accidents, down by 16.9%. The road traffic death toll per 10 thousand vehicles was 1.54, a decrease of 0.17 compared with last year.
Notes:
1. All figures in this Communiqué are preliminary statistics. There may be slight discrepancy between the sum of individual items and the total owing to rounding.
2. Gross domestic product (GDP) and industrial added value as quoted in this Communiqué are calculated at current prices, whereas their growth rates are calculated at constant prices.
3. According to “National Industries Classification” (GB/T4754-2011), State Statistics Bureau revised the triple divisions of industry in 2013. The services of “farming, forestry, animal husbandry and fishery”, “mining auxiliary activities” of “mining industry” and “repair services of metal product, machinery and equipment” in “manufacturing industry” were divided into the tertiary industry, so the data in 2016 of the tertiary industry was counted depends on this standard.
4. Changsha-Zhuzhou-Xiangtan (CZT) region refers to Changsha, Zhuzhou and Xiangtan; southern Hunan refers to Hengyang, Chenzhou and Yongzhou; western Hunan refers to Shaoyang, Zhangjiajie, Huaihua, Loudi and Xiangxi autonomous prefecture; Dongting Lake areas refers to Yueyang, Changde and Yiyang.
5. The high-tech manufacturing industries include the manufacturing of medicine, aerospace, electronic and telecommunication equipment, computer and office equipment, medical equipment and instrumentation, and chemicals used in information store.
6. According to relevant regulations, the foreign trades are accounted in RMB.
7. The enrollment rate for elementary-age kids refers to the percentage of school-age children in primary school to the total number inside and outside of the school within the scope of investigation.
8. The secondary gross enrollment ratio mainly reflects the coverage of senior secondary education, referring to the percentage of the total number of high school students to population aged 15-17.
9. In figure 6, the indicator of disposable income for rural dwellers was named net income for rural dwellers for the year of 2011-2013.
10. Resident population refers to the population of often living actually in a certain area in a certain time. According to the census and sampling requirements, it mainly includes people who live in the current townships and whose household registration are located or whose household registration is to be settled; people who live in the current townships and leave the townships of their household registration over 6 months; people who leave the townships of their household registration for less than 6 months or work or study overseas, with their household registration located in the current townships.
11. At the end of 2016, the population aged 0-14 (under 15) was 12.642 million; the population aged 15-59 (under 60) was 43.567 million.
12. In 2016, the number of the sections across which water was monitored increased over the previous year, therefore the statistical caliber are not comparable with 2015.
13. A direct reporting reform on the accident statistics was carried out by the State Work Safety Commission, which caused the statistical caliber incomparable with 2015.
14. The figures of energy consumption are verified initially by National Bureau of Statistics of China.
Source:
In this communique,fiscal data are from the Hunan Financial Department. Goods’ Prices, the income and expenditure of urban and rural residents, the Engel’s coefficient and data in the agricultural section are from the NBS Survey Office in Hunan; data about rail mileage are from Shichang Railway Co., Ltd, Guangzhou Railway (group) Company and Nanchang Railway Administration; data about the traffic volume and the turnover volume of passengers and cargo in highway, turnover volume of passengers and cargo in waterway and highway mileage are from Hunan Road Transport Bureau; data about the traffic volume and the turnover volume of passengers and cargo in civil aviation are from Hunan Airport Management Co., Ltd; data about volume of freight traffic by pipeline are from Changling Branch and Baling Branch of China Petrochemical Group Assets Management co., LTD, Changling branch of China Petrochemical co., LTD, Hunan Oil Transportation Management Department of China Petrochemical Marketing co., LTD central-China Branch, and Changsha Xinao Gas co., LTD; data about car ownership and road traffic accident are from Provincial Public Security Bureau; data about telecommunications business, mobile phone users, fixed telephone users, broadband Internet users are from Hunan telecommunications company, Hunan Mobile Company, Hunan Unicom Company, Hunan Tietong Company; Data about postal business are from Hunan Postal Service Administration; Travel data are from Hunan Tourism Bureau; The financial data are from Changsha Central Sub-branch of the People's Bank of China; data about listed company are from Hunan Financial Affairs Office; stock data are from Hunan authority of China Securities Regulatory Commission; Insurance data are from the Hunan Authority of China Insurance Regulatory Commission; Education data are from Hunan Education Department; Data about science and technology are from Hunan Science and Technology Department; Patent data from Hunan Intellectual Property Office; data about quality inspection, industry standard are from Hunan Quality and Technical Supervision Bureau; data about mapping, mineral resources, geological parks and land are from Hunan Land and Resources Ministry; data about art performing groups, museums, public libraries, cultural centers, non-material cultural heritage protection are from the Cultural Department of Hunan; data are from the Bureau Radio and Television of Hunan Province; data about radio, television, newspapers, periodicals and book are from the Press and Publication of Hunan; data about hygiene and new rural cooperative medical service are from the Hygiene Bureau and Family Planning Committee of Hunan; data about sports are from the Sports Bureau of Hunan; data about newly-added urban jobs and social security are from Human Resources and Social Security Department; data about insurances providing for urban and rural low-income people, social welfare, community services, nursing homes and social donation are from the Department of Civil Affairs of Hunan; data about healthy drinking water provision to rural area are from the Water Resources Bureau of Hunan; data about rehabilitation of rural dilapidated housing, construction of security housing and disposal of sewage and garbage are from the Housing and Construction Department of Hunan; data about nature reserve, forestation, standing tree and coverage of forest are from Hunan Forestry Department; data about the quality of surface water and pollutant emission are from the Environmental Protection Bureau of Hunan Province; data about safe production are from the Work safety Administration of Hunan; all the other data are from Hunan Bureau of Statistics.